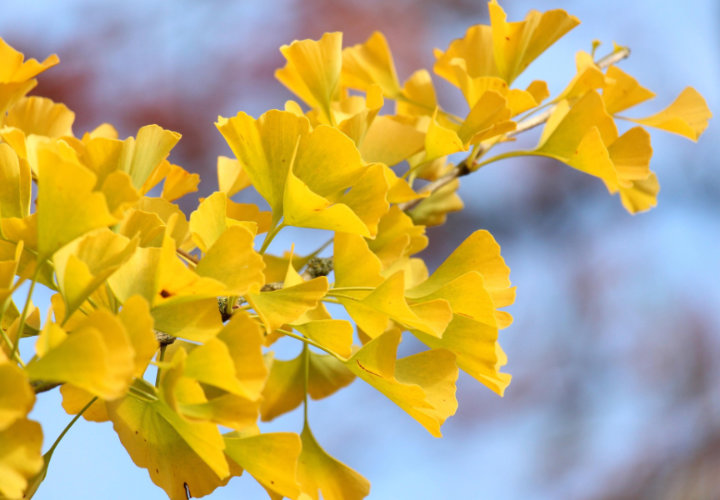
Phenology
Phenology is the rhythm of the natural world and results from interactions between biology and the environment.
I'm an aquatic and terrestrial scientist who uses data science to uncover controls on environmental processes. I share my work by publishing articles, making data visualizations, giving talks, and creating public datasets and software. I have over 8 years of experience as an academic and federal scientist and deliver trustworthy results that elevate the understanding of my cooperators.

I enjoy interdisciplinary projects and have worked across various systems including forests, rivers, and lakes. My work is generally focused on identifying and explaining patterns of ecosystem processes in relationship to the climatic, physical, or chemical factors which drive them.
Phenology is the rhythm of the natural world and results from interactions between biology and the environment.
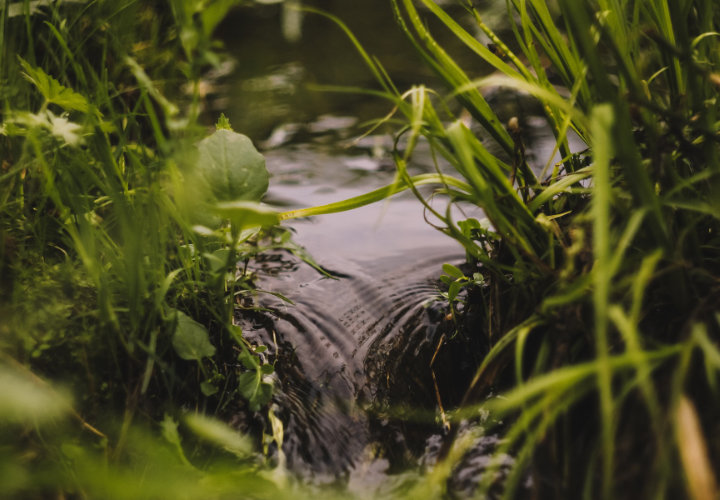
Assessing water resources based on a combination of biological, chemical, and physical characteristics.
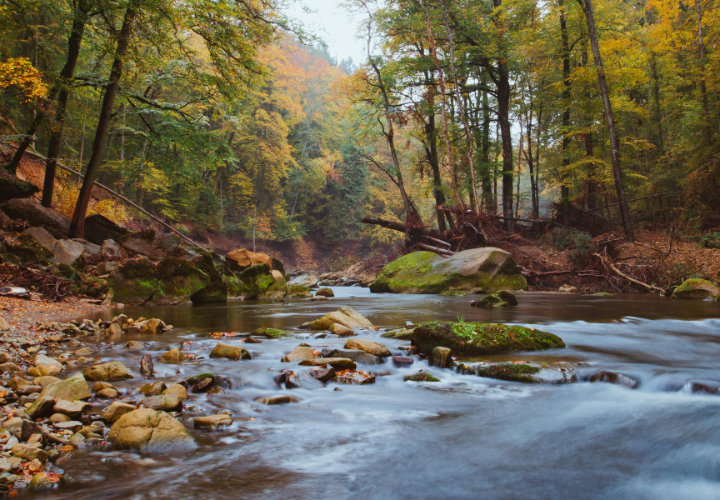
How ecosystems create and consume energy.
Limnology and Oceanography, 64(5), 1835–1851
The seasonality of photosynthesis in rivers impacts many ecosystem processes, but are there common patterns of productivity across rivers? We used time series of productivity data from 47 rivers to identify common patterns of river productivity and linked those groups back to environmental drivers to provide a framework for comparing rivers across diverse conditions.
Full articleWater Resources Research, 59(11), e2022WR034215
Eutrophication is one of the largest threats to aquatic ecosystems and chlorophyll a measurements are widely collected indicators of algal abundance or trophic state. While many models of river chlorophyll a have been made, they are almost overwhelmingly made and tested at a single site. We compiled a large national dataset, tested a general model of river chlorophyll across many rivers, and examined which factors where most important for making accurate predictions.
Full article DatasetEcological Indicators, 173, 113403
Cyanobacteria harmful algal blooms (cyanoHABs) are a growing concern for for both environmental and human health, but most states lack funding for monitoring. We designed models to predict algal concentrations and cyanoHABS across 110 New York State lakes and identified a simple low-cost measure that was as effective as costlier laboratory measures for predicting cyanoHABs.
Full article DatasetComplex ideas at a glance. I take large amounts of data or complicated ideas and distill them down into easy to digest figures and graphics.
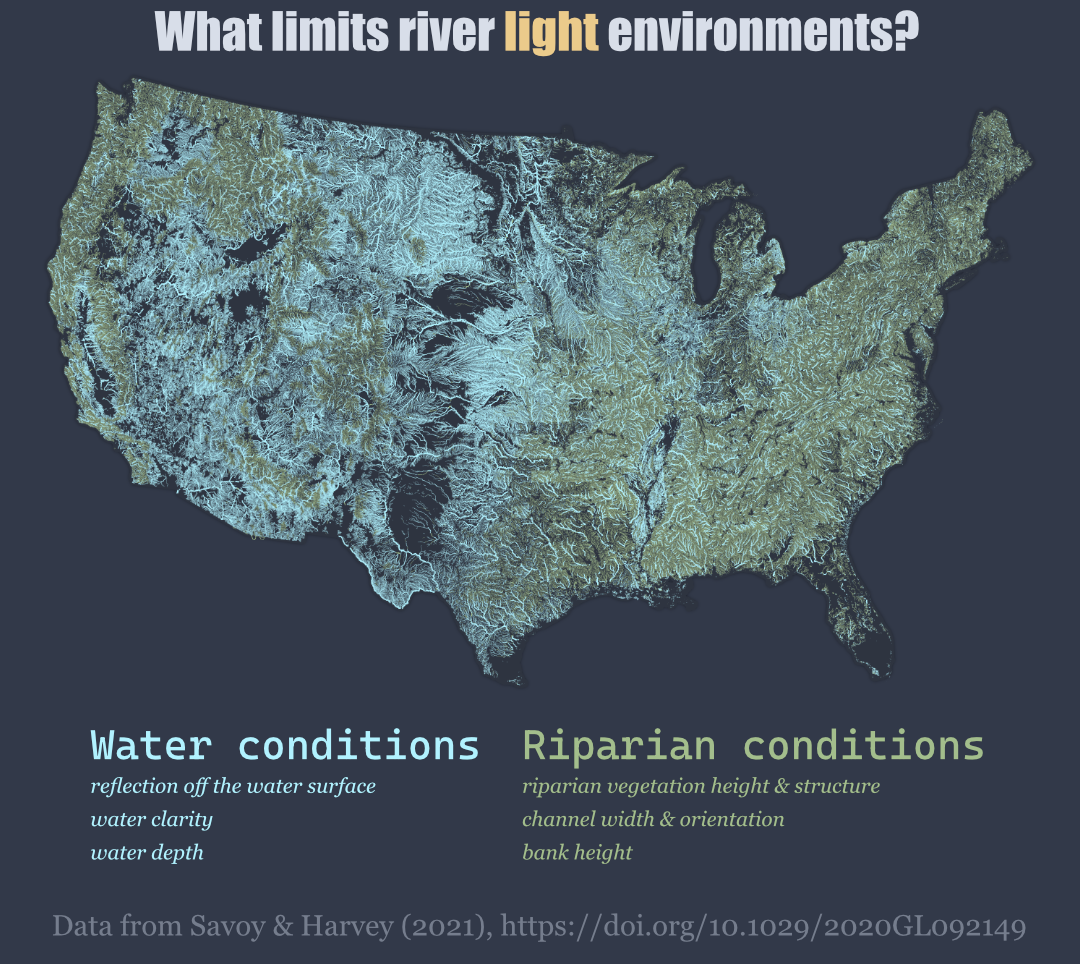
We predicted what limits light available for river primary producers at over 2 million reaches and estimated that water column processes most limited productivity for 50% of the nation’s river length and 80% of its surface area.
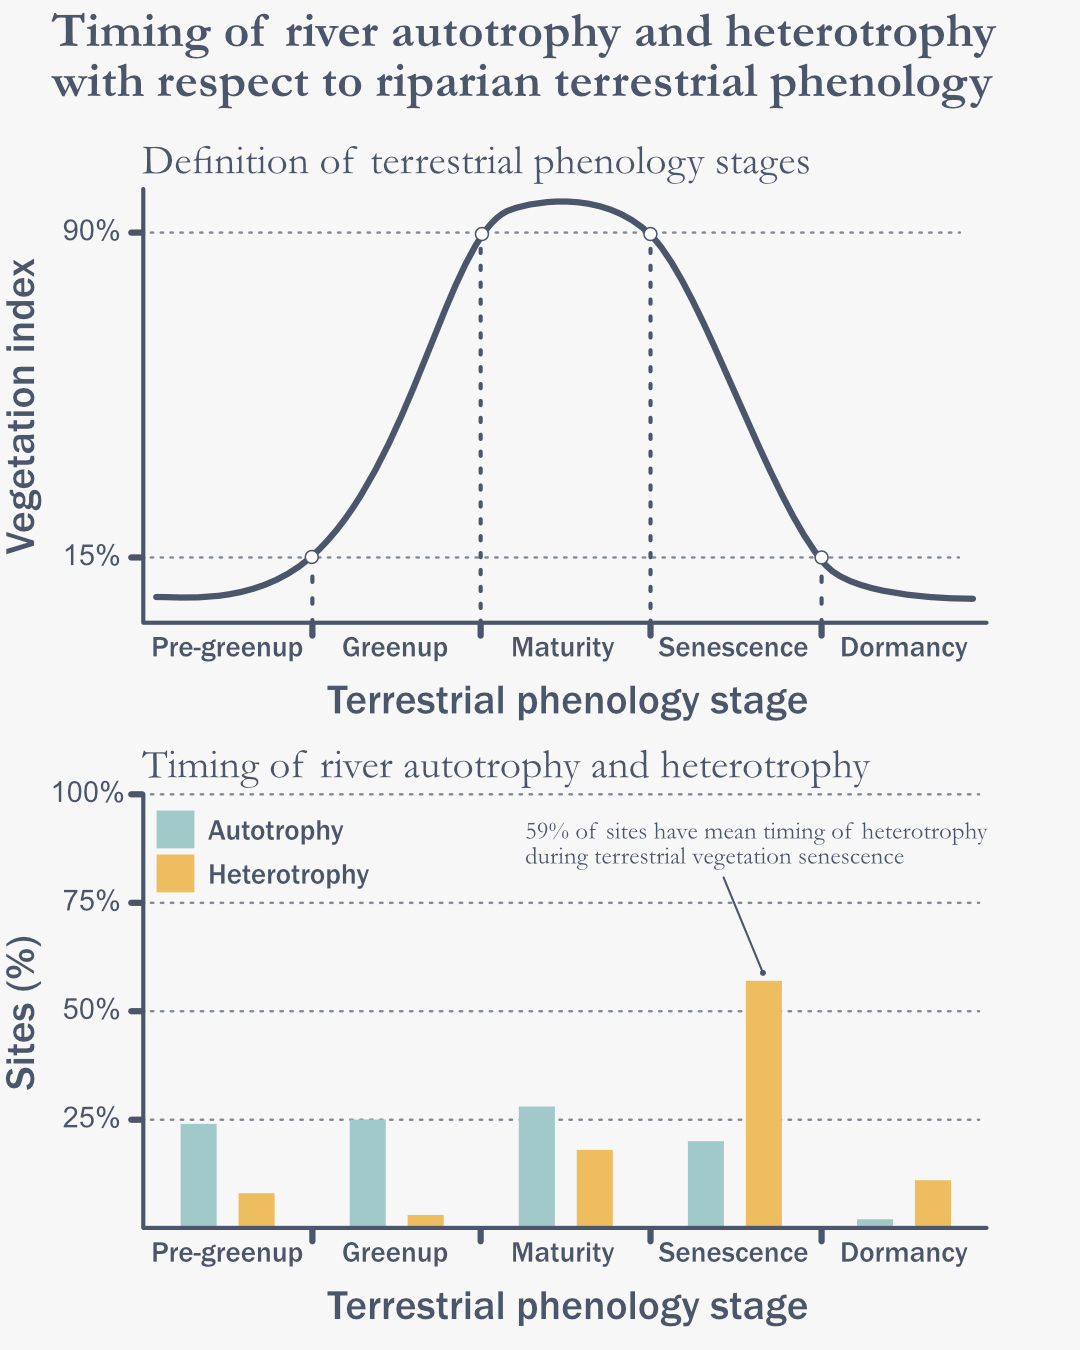
Production and consumption of energy in rivers changes throughout the year in relation to seasonal changes in terrestrial vegetation. Observed higher rates of heterotrophy during leaf senesecence may be related to higer inputs of organic matter from leaf litterfall.
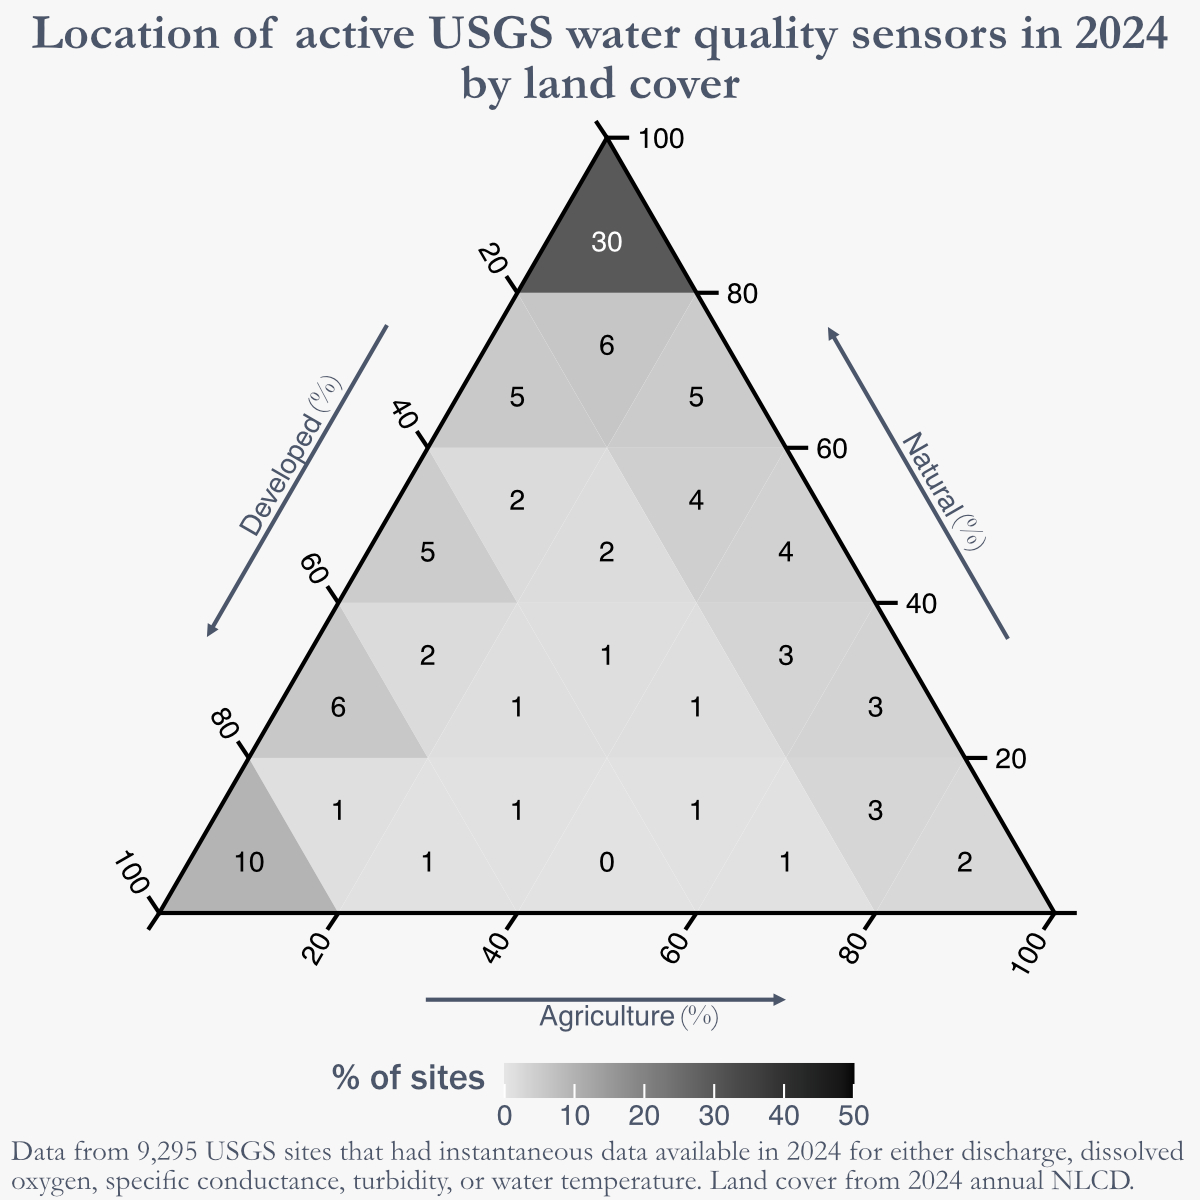
The United States Geological Survey maintains a number of sensors which continuously monitor water quality. In the lower 48 states, 46% of those sites were located at sites where the surrounding land cover was mostly natural and only 9% of the sites were located in predominantly agriculture.
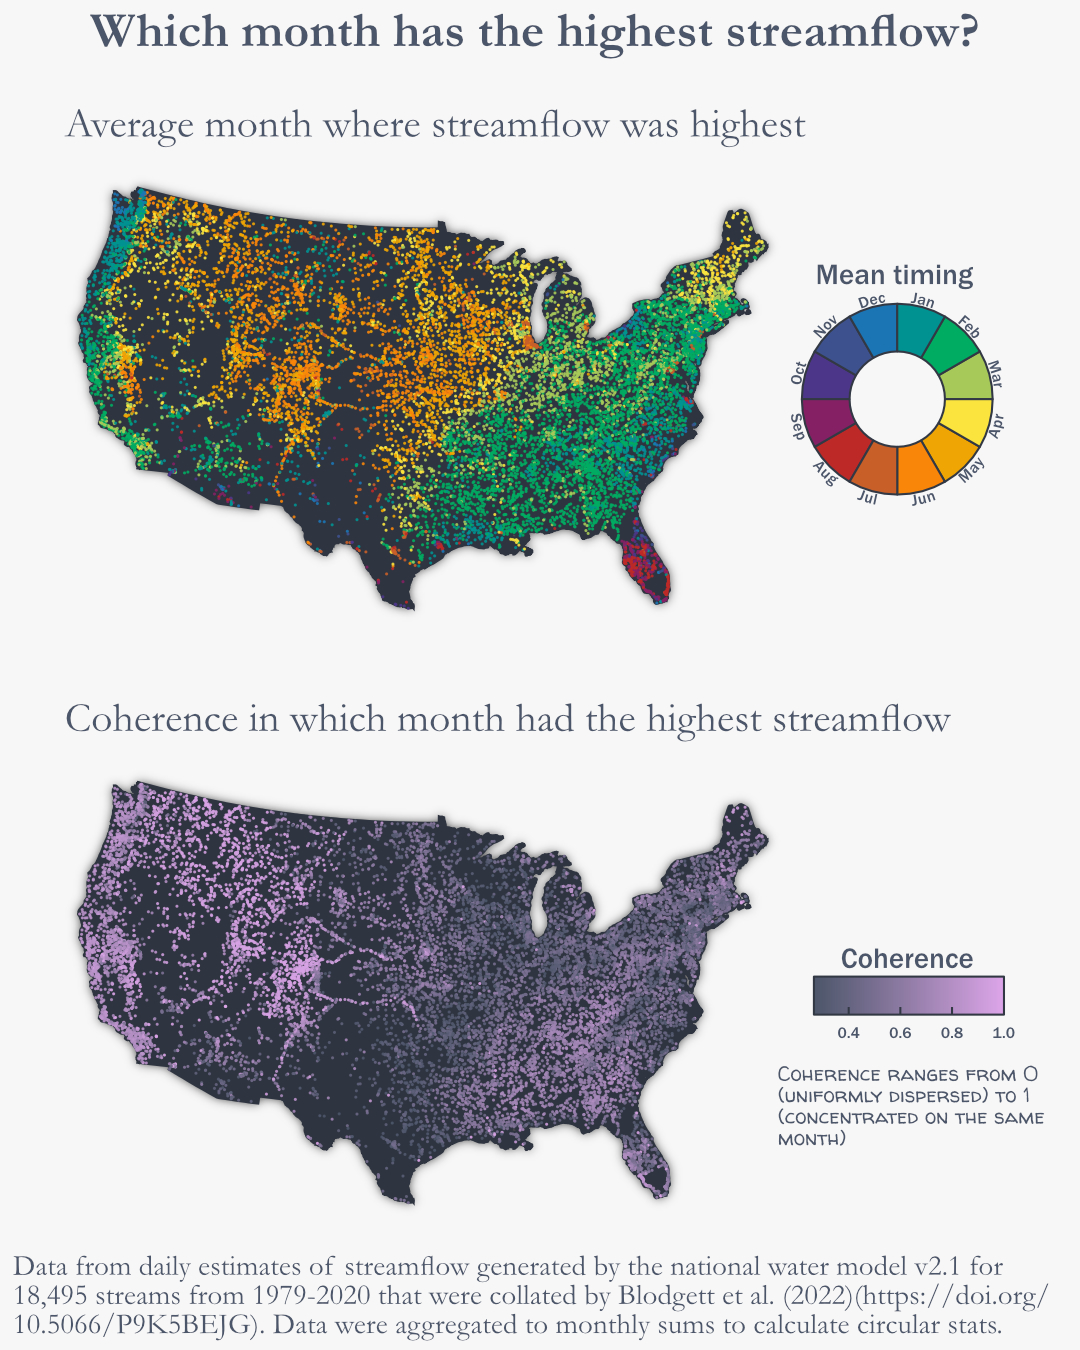
Using streamflow estimates from 18,495 streams from 1979-2020 I calculated which months had the highest total streamflow. I also examined whether the highest streamflow tends to happen regularly at the same time of year.
I'm an experienced scientist with a track record of publishing robust work in well-respected journals.
I develop models to better understand the natural world. Through iterative testing, interpretation, and refinement we can both gain new insights and improve model accuracy.
My work relies on compiling large multi-source public datasets of climate data, remote sensing, land use, site conditions, and field measurements. I’ve produced publicly available datasets totaling over 80 million records.
I build robust and well documented code to help me gather datasets, develop models, create data visualizations, and communicate results to collaborators and stakeholders.
I use a variety of statistical approaches to identify and interpret complex environmental processes. I'm experienced in analysis of both time series and spatial data.
Data visualization and graphic design have been interests of mine since grad school. I enjoy making clear, intuitive, and understandable graphics to explain complex ideas.
I've published my research in well-respected journals in both aquatic and terrestrial science. I also communicate my work by presenting at professional conferences and workshops across the U.S.